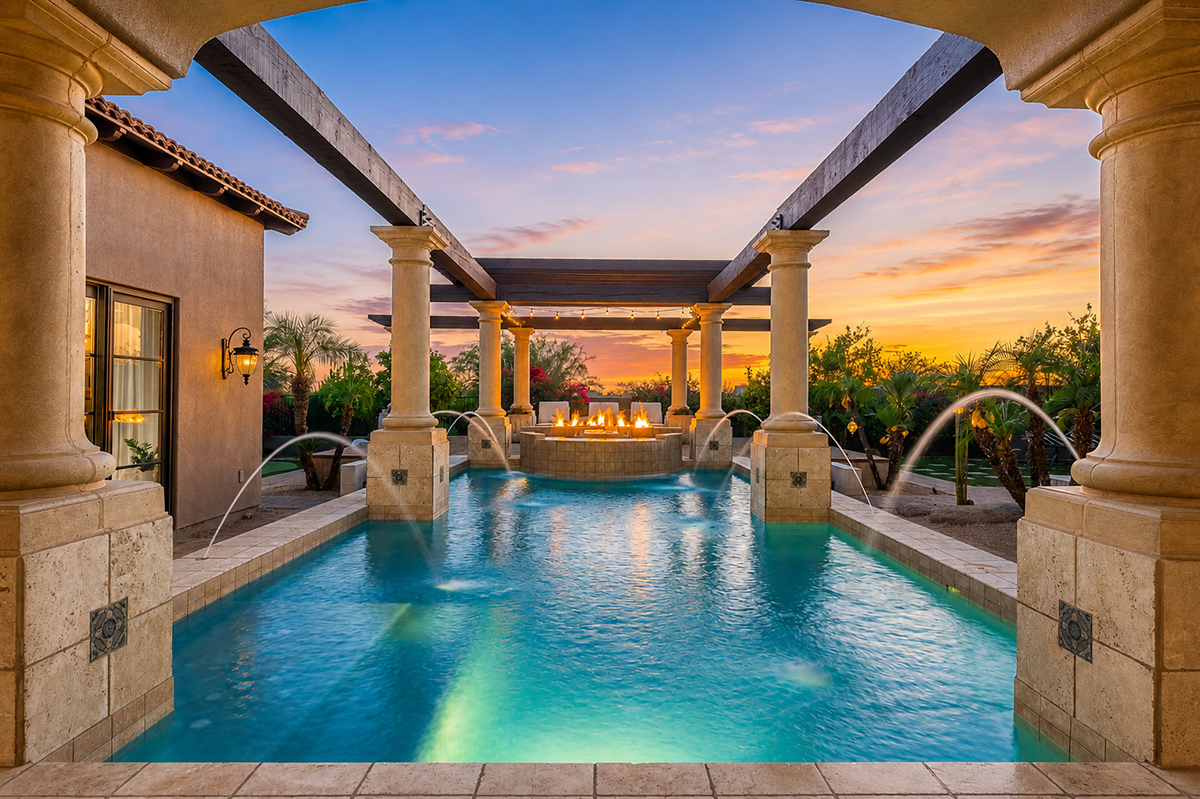
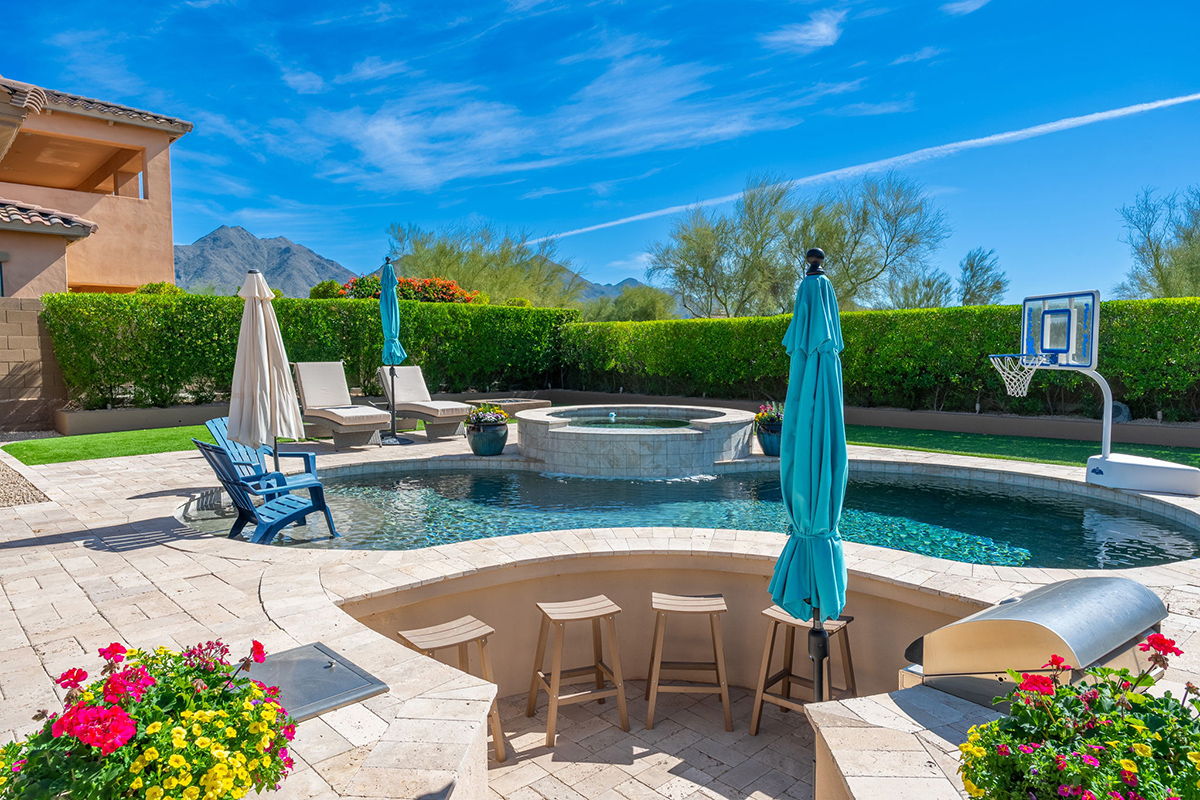
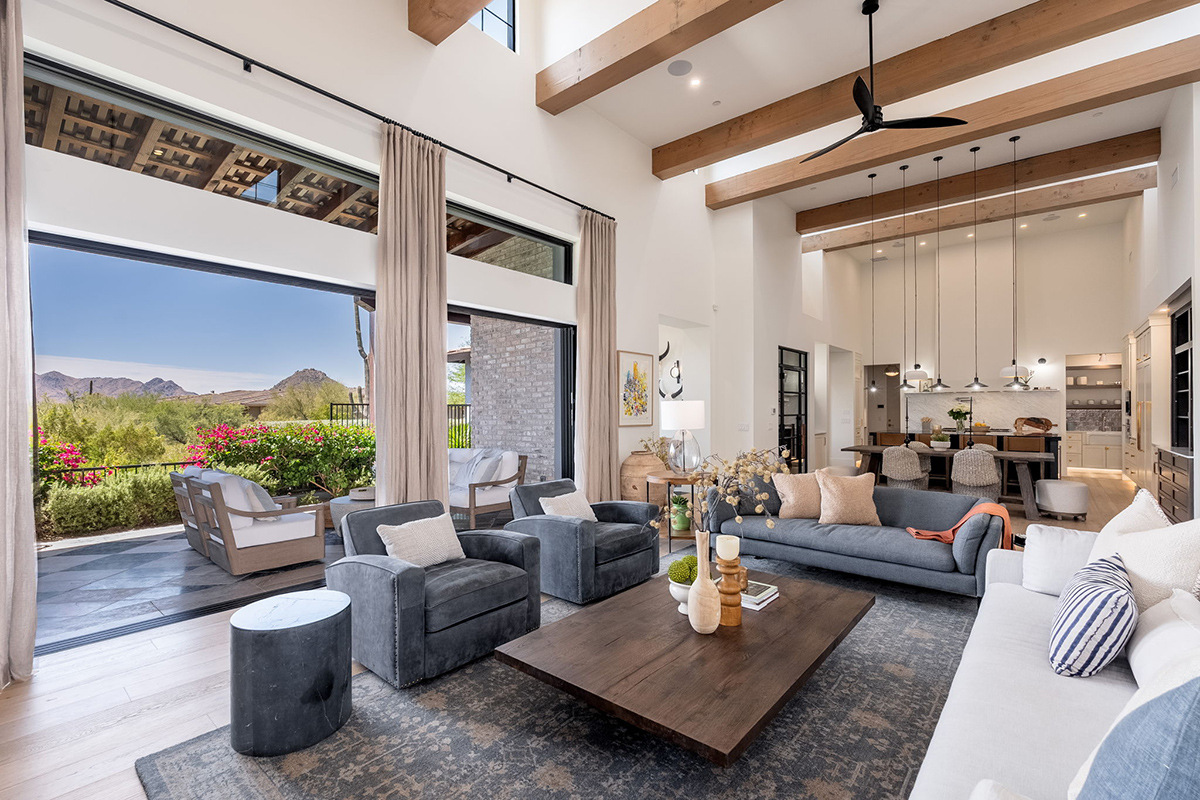
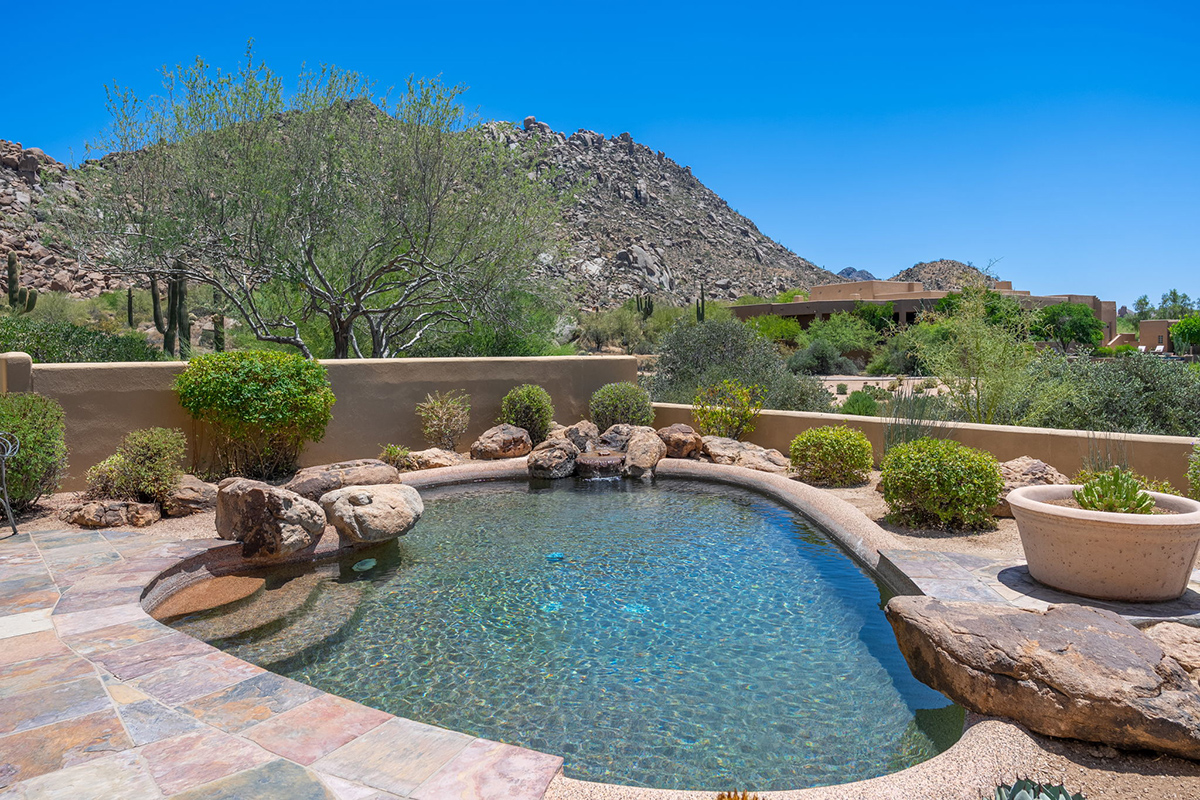
Mirabel Club Recent Home Sales
Mirabel Club Recent Home Sales
Return to Mirabel Club Map Mirabel Club Market Analysis Mirabel Club Sales Trend Chart MLS Search Mirabel ClubSummary of home sales within the past six (6) months in Mirabel Club. Individual properties are unique.
Consult a Realtor who lives and works in the area. Contact Us
Updated Sunday May 24, 2026
El Corazon
2 properties sold. - Average $2,316,250 - $641.6 /SqFt. Selling average of 96.2% of asking price.
Sold range from $1,982,500 to 2,650,000. - Size range from 3,333 to 3,850 sf.
| Nov 17 | Lot 186 | 4 bed/4.5 bath | 3,850 sf | $2,650,000 - $688.3/sf |
| May 08 | Lot 199 | 3 bed/4 bath | 3,333 sf | $1,982,500 - $594.8/sf |
Mirabel
8 properties sold. - Average $4,553,125 - $786.0 /SqFt. Selling average of 94.7% of asking price.
Sold range from $2,350,000 to 6,500,000. - Size range from 4,493 to 7,511 sf.
| Dec 08 | Lot 14 | 4 bed/5 bath | 4,493 sf | $2,350,000 - $523.0/sf |
| Jan 05 | Lot 129 | 5 bed/6 bath | 6,169 sf | $4,300,000 - $697.0/sf |
| Jan 07 | Lot 236 | 6 bed/8 bath | 7,511 sf | $3,750,000 - $499.3/sf |
| Feb 10 | Lot 27 | 5 bed/7 bath | 5,724 sf | $4,175,000 - $729.4/sf |
| Feb 17 | Lot 337 | 5 bed/6 bath | 6,983 sf | $6,500,000 - $930.8/sf |
| Feb 27 | Lot 344 | 4 bed/5 bath | 4,802 sf | $4,100,000 - $853.8/sf |
| Mar 16 | Lot 244 | 4 bed/5 bath | 6,295 sf | $5,750,000 - $913.4/sf |
| May 05 | Lot 225 | 4 bed/4.5 bath | 4,821 sf | $5,500,000 - $1,140.8/sf |
Mirabel Club Homes Recently Sold.
Based on information from the Arizona Regional Multiple Listing Service (ARMLS).
Included are Homes Sales within the past six (6) months (since November 2025).
All information should be verified by the recipient. If you have questions Contact The Luckys.
Newsletter
Want to stay in-the-know about all things Scottsdale? Subscribe to our monthly newsletter.
"*" indicates required fields
Contact Us
Lisa Lucky602.320.8415
Matt Lucky
480.390.0445
Laura Lucky
480.390.5044
All.Lucky@RussLyon.com
Address
Russ Lyon Sotheby'sInternational Realty
7669 E Pinnacle Peak Rd
Suite 110 Scottsdale, AZ
85255
Social


We Are Sotheby’s International Realty
26,000 agents strong, with 1,075 plus offices in 81 countries and territories worldwide. Representing one in every four sales in North Scottsdale – Twice the market share of our nearest competitor. Sotheby’s International Realty® is a registered trademark licensed to Sotheby’s International Realty Affiliates LLC. Each Office Is Independently Owned and Operated.

© 1999 - 2026 The Luckys North Scottsdale All rights reserved. North Scottsdale Real Estate