

Sereno Canyon Sales Trend Chart
Sereno Canyon Year Over Year Sales Chart
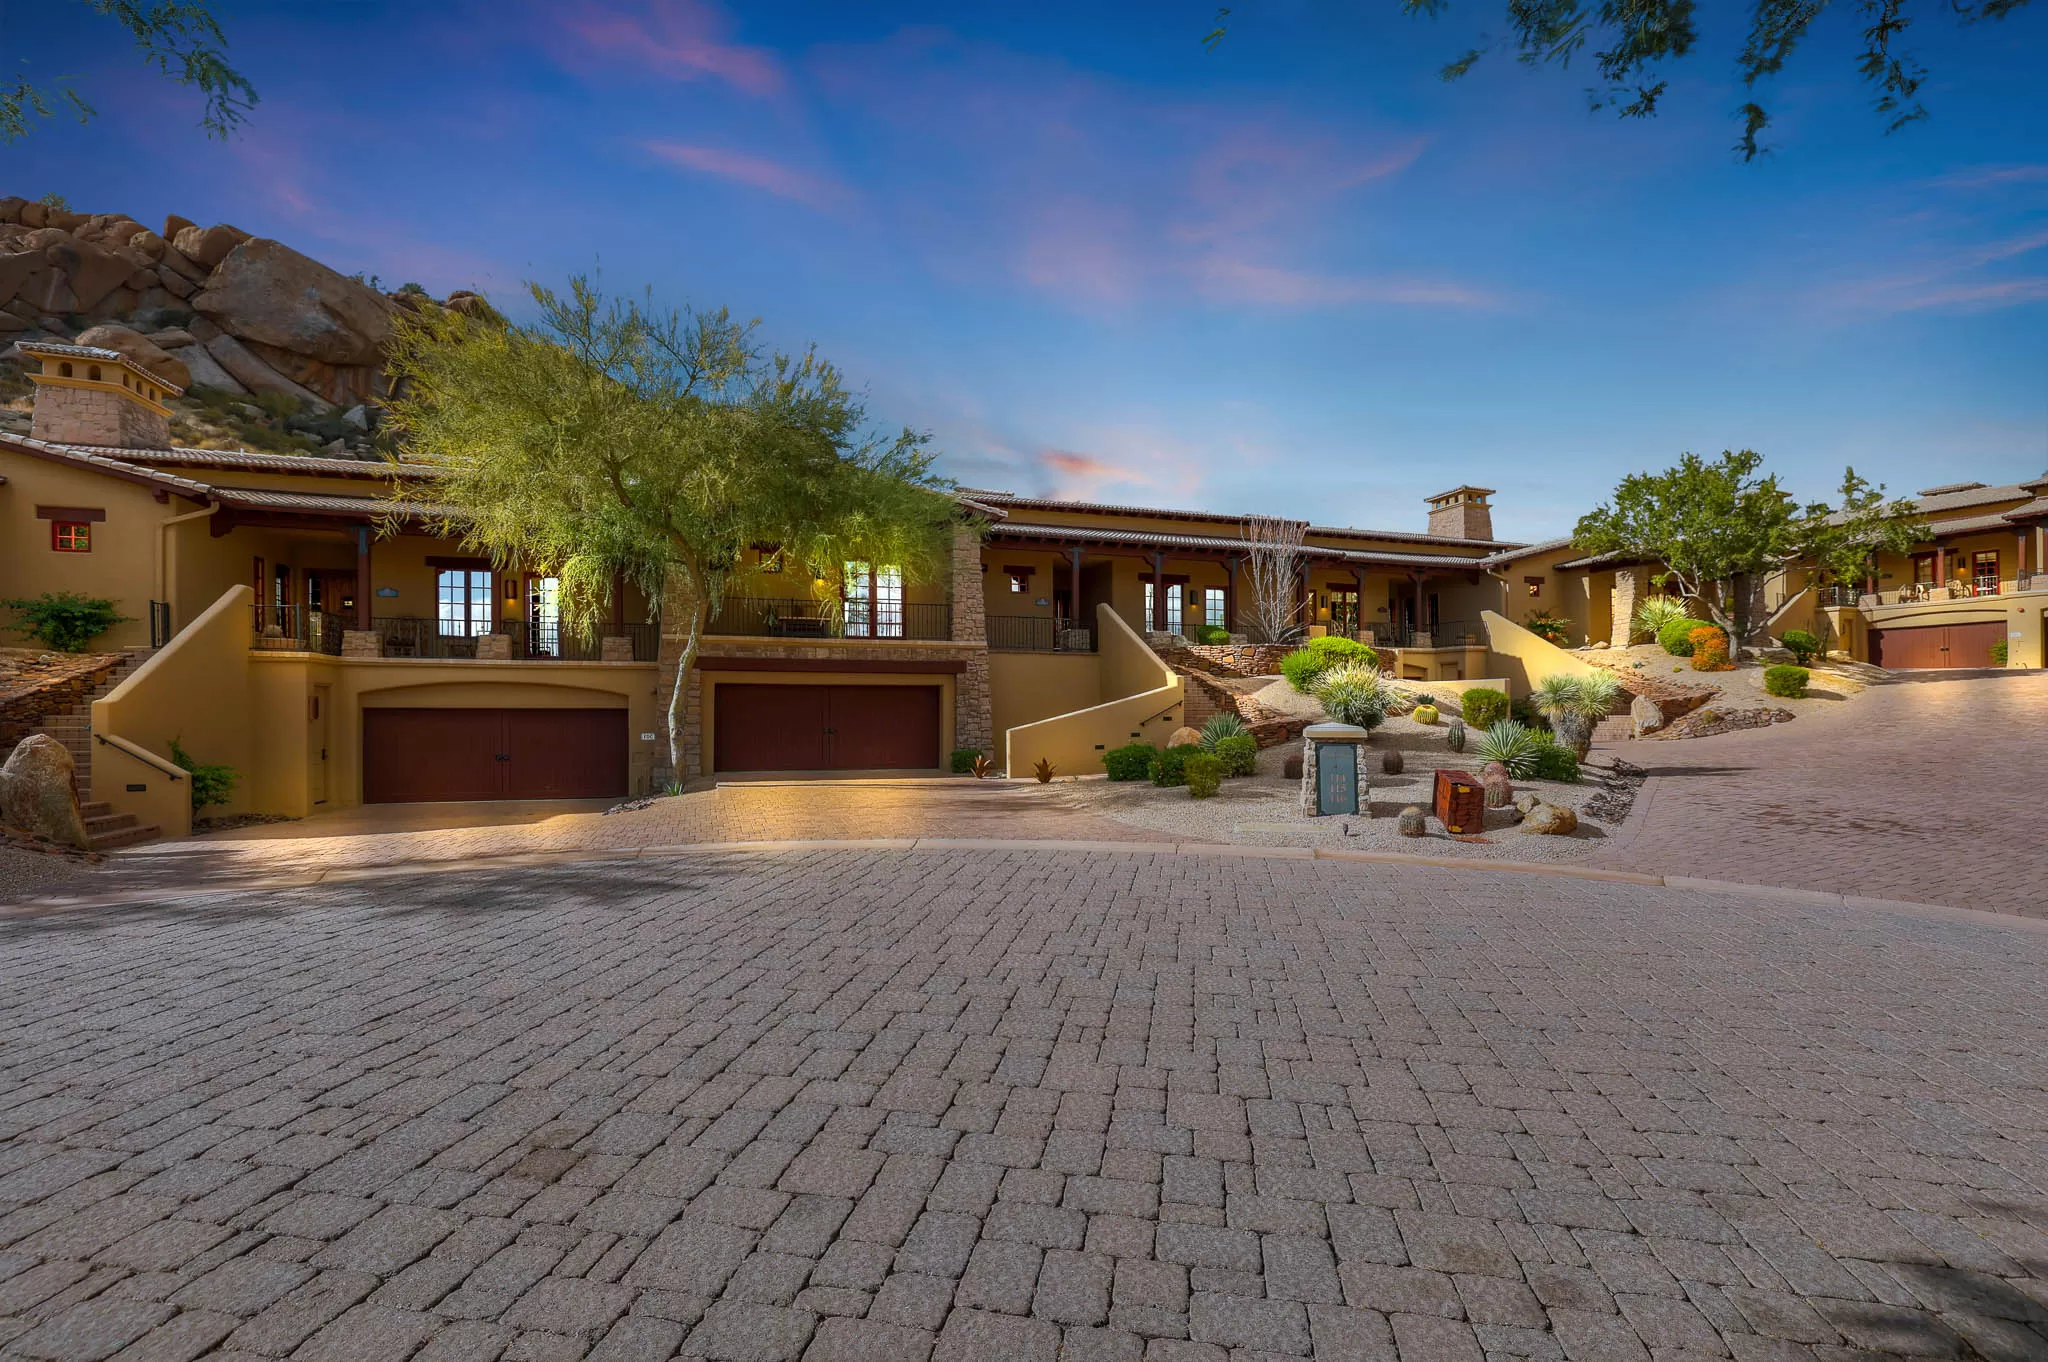
Return to Sereno Canyon Map Sereno Canyon Market Trend Chart Sereno Canyon Recent Home Sales MLS Search Sereno CanyonFor current market insights consult a Realtor who lives and works in the area. Contact Us.
Updated Saturday April 04, 2026
Sereno Canyon Sales Trend Chart | North Scottsdale Arizona.
Based on information from the Arizona Regional Multiple Listing Service (ARMLS).
All information should be verified by the recipient. If you have questions Contact The Luckys.


