Sincuidados Recent Home Sales
Sincuidados Recent Home Sales
Return to Sincuidados Map Sincuidados Market Analysis Sincuidados Sales Trend Chart MLS Search SincuidadosSummary of home sales within the past six (6) months in Sincuidados. Individual properties are unique.
Consult a Realtor who lives and works in the area. Contact Us
Updated Sunday May 24, 2026
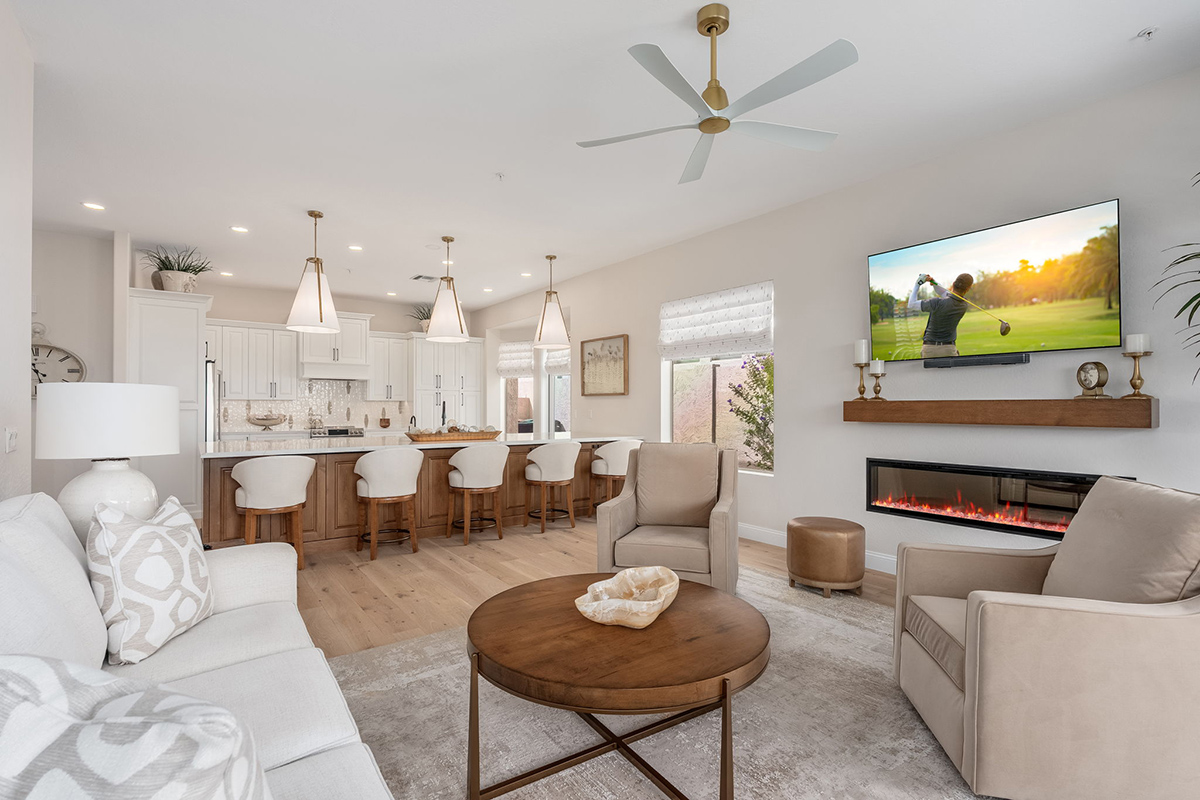
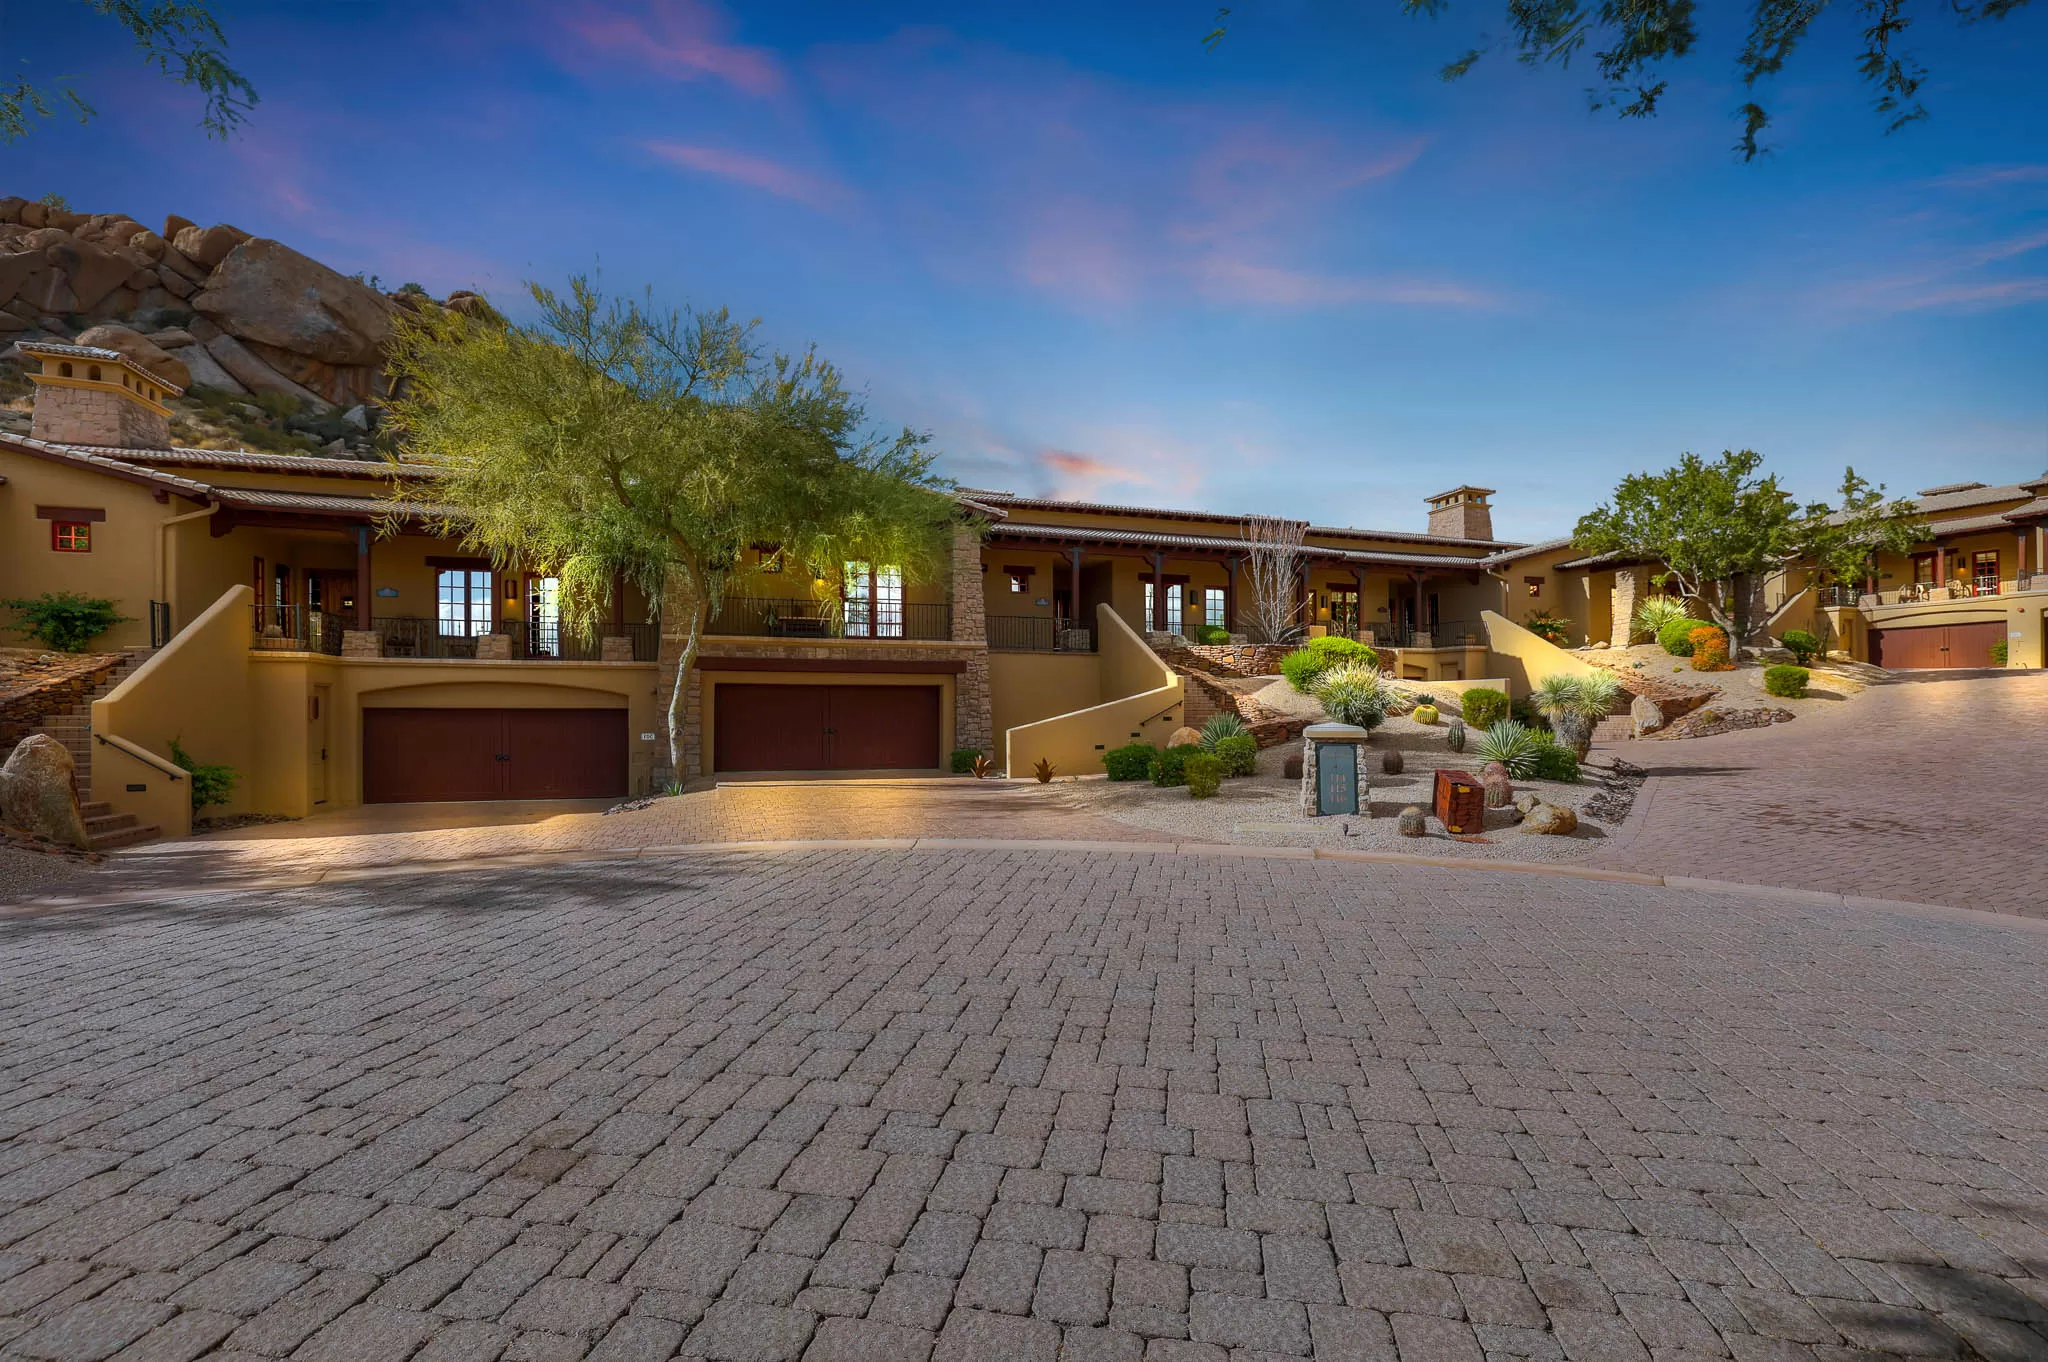
Sincuidados
15 properties sold. - Average $2,234,689 - $517.4 /SqFt. Selling average of 97.7% of asking price.
Sold range from $1,500,000 to 3,000,000. - Size range from 3,513 to 6,182 sf.
| Dec 16 | Lot 37 | 3 bed/4 bath | 3,513 sf | $2,330,000 - $663.3/sf |
| Dec 22 | Lot 225 | 3 bed/4 bath | 4,574 sf | $2,025,000 - $442.7/sf |
| Dec 22 | Lot 104 | 4 bed/5 bath | 4,576 sf | $2,463,329 - $538.3/sf |
| Jan 30 | Lot 34 | 4 bed/5 bath | 4,392 sf | $2,750,000 - $626.1/sf |
| Feb 09 | Lot 11 | 3 bed/4 bath | 4,383 sf | $2,475,000 - $564.7/sf |
| Feb 23 | Lot 47 | 4 bed/4 bath | 3,811 sf | $1,925,000 - $505.1/sf |
| Mar 12 | Lot 112 | 3 bed/4 bath | 3,840 sf | $1,622,000 - $422.4/sf |
| Mar 23 | Lot 49 | 4 bed/5 bath | 4,672 sf | $2,255,000 - $482.7/sf |
| Mar 23 | Lot 35 | 3 bed/4 bath | 4,317 sf | $2,115,000 - $489.9/sf |
| Mar 31 | Lot 81 | 5 bed/5 bath | 4,517 sf | $2,025,000 - $448.3/sf |
| Mar 31 | Lot 306 | 5 bed/5 bath | 3,698 sf | $2,800,000 - $757.2/sf |
| Apr 02 | Lot 73 | 5 bed/5 bath | 6,182 sf | $3,000,000 - $485.3/sf |
| Apr 30 | Lot 186 | 3 bed/4 bath | 4,001 sf | $1,500,000 - $374.9/sf |
| May 18 | Lot 289 | 4 bed/5 bath | 3,805 sf | $2,150,000 - $565.0/sf |
| May 21 | Lot 147 | 5 bed/5 bath | 5,278 sf | $2,085,000 - $395.0/sf |
Sincuidados Homes Recently Sold.
Based on information from the Arizona Regional Multiple Listing Service (ARMLS).
Included are Homes Sales within the past six (6) months (since November 2025).
All information should be verified by the recipient. If you have questions Contact The Luckys.
Newsletter
Want to stay in-the-know about all things Scottsdale? Subscribe to our monthly newsletter.
"*" indicates required fields
Contact Us
Lisa Lucky602.320.8415
Matt Lucky
480.390.0445
Laura Lucky
480.390.5044
All.Lucky@RussLyon.com
Address
Russ Lyon Sotheby'sInternational Realty
7669 E Pinnacle Peak Rd
Suite 110 Scottsdale, AZ
85255
Social


We Are Sotheby’s International Realty
26,000 agents strong, with 1,075 plus offices in 81 countries and territories worldwide. Representing one in every four sales in North Scottsdale – Twice the market share of our nearest competitor. Sotheby’s International Realty® is a registered trademark licensed to Sotheby’s International Realty Affiliates LLC. Each Office Is Independently Owned and Operated.

© 1999 - 2026 The Luckys North Scottsdale All rights reserved. North Scottsdale Real Estate