
No Longer Maintain
This West of Desert Mountain Market Analysis is provided in forr (4) sections:
Trend Charts; Type of Sales; Quarterly Real Estate Summary; and Six Month Real Estate Trends & Statistics.
The data presented below provides a broad view of the market. Market trends vary by community. Individual properties are unique. Don’t let analysis paralysis keep you on the sidelines. Consult a Realtor who lives and works in the area. Contact Us
We have have some good tools that supplement our first hand knowledge of homes in these communities. For example, Collateral Analytics, our exclusive ‘bank grade’ Interactive Automation Valuation Model (valuation) to help value your home or property of interest. No tool will top the collective experience of Lisa, Laura, and Matt Lucky. Lisa is once again Russ Lyon Sotheby’s International Realty’s top producing Realtor for 2019.
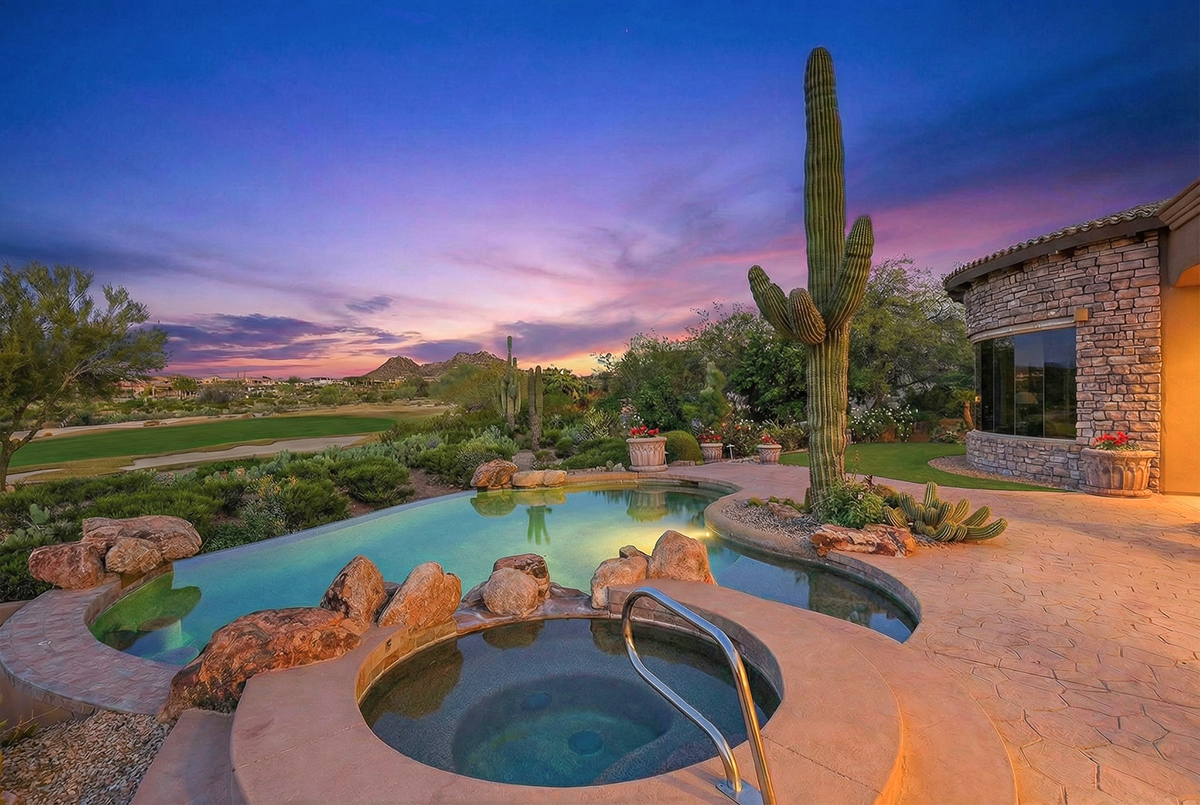
Return to West of Desert Mountain Map West of Desert Mountain Home Sales Trend West of Desert Mountain Recent Home Sales MLS Search West of Desert MountainUpdated Thursday March 13, 2025
West of Desert Mountain Real Estate Trend Charts
Click here for Recent Sales Charts.
These West of Desert Mountain charts include: Percentage of Asking Price; Days on Market; Livable Square Feet; Sold Price; and the all important Price Per Square Feet for each West of Desert Mountain sale.
These are scatter charts showing each sale by closing date. Great way to look for trends.
West of Desert Mountain Summary of Home Sales By Type
| Type of Sale | Sales in past 6 months | Avg Days on market | Avg Square Footage | Avg Sale Price | Avg % of Asking Price |
|---|---|---|---|---|---|
| Resale | 2 | 70 | 6,474 | 4,375,000 | 97.90% |
| Short Sale | 0 | n/a | n/a | n/a | n/a |
| Lender Owned | 0 | n/a | n/a | n/a | n/a |
Included are Homes Sales within the past six (6) months(since September 2024)
West of Desert Mountain Quarterly Real Estate Summary
| Guide | Number Sold | Avg Price/Sq Ft | Avg Sold Price | Avg % of Asking Price |
|---|---|---|---|---|
| 3rd quarter of 2024 Last Qtr | 0 | n/a | n/a | n/a |
| 4th quarter of 2023 Last Yr | 0 | n/a | n/a | n/a |
| 4th quarter of 2024 Most Recent | 1 | 432.8 | 3,000,000 | 100.0 |
Six Month Real Estate Trends & Statistics
| Guide | Days On Market | Home Size | Sold Price | % of Asking Price |
|---|---|---|---|---|
| Highest | 113 | 6,931 sf | 5,750,000 | 100.00% |
| Average | 70 | 6,474 sf | $4,375,000 | 97.90% |
| Lowest | 27 | 6,018 sf | 3,000,000 | 95.80% |
Based on information from the Arizona Regional Multiple Listing Service (ARMLS) for the period Sep, 2024 through Feb, 2025.
ARMLS is where cooperating brokers share listing information. Excluded from the data above are home sales not found in ARMLS and sales by brokers who choose not to market their listing(s) on the internet.
All information should be verified by the recipient. If you have questions Contact The Luckys.
Included are Homes Sales within the past six (6) months (since September 2024).


